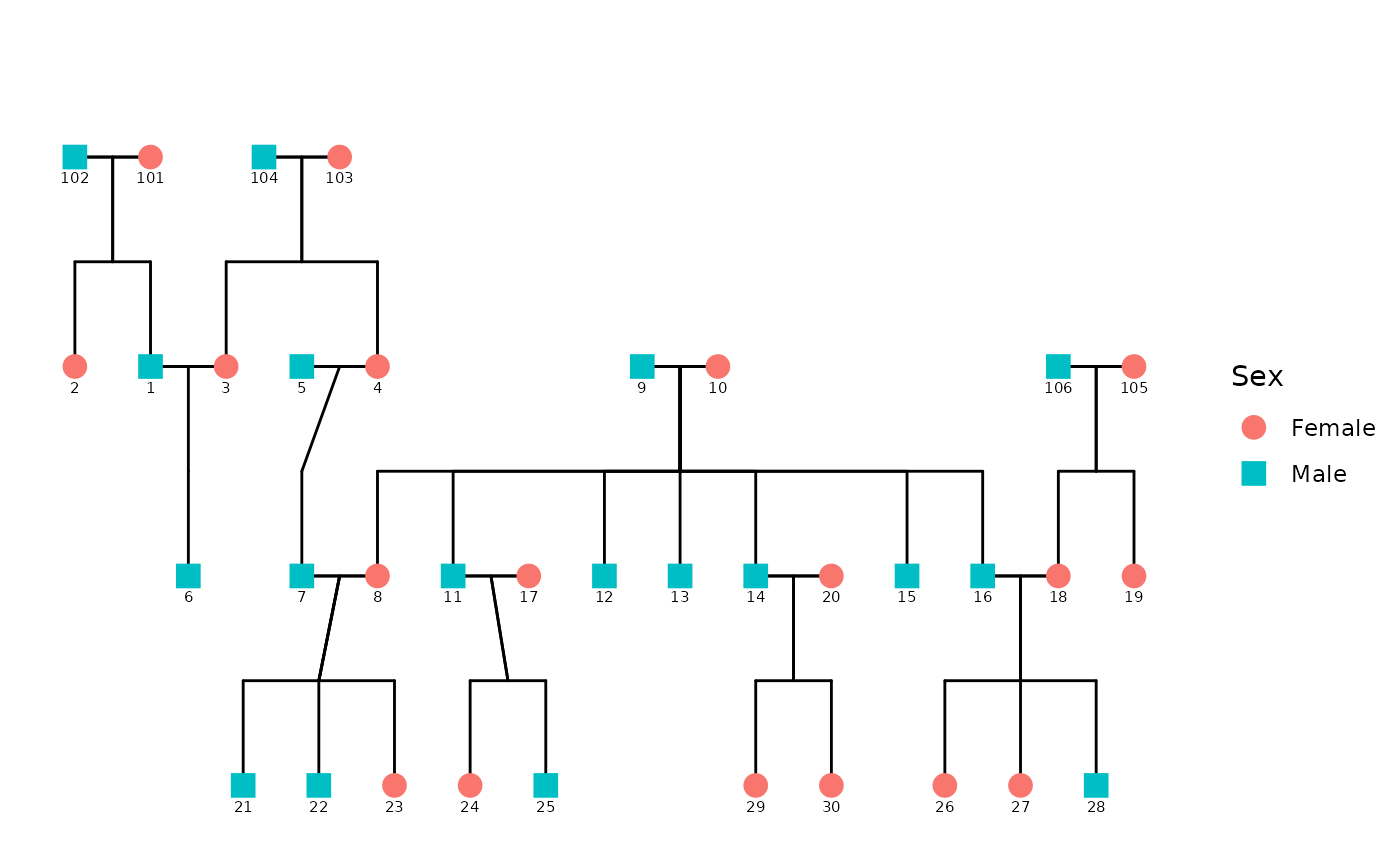
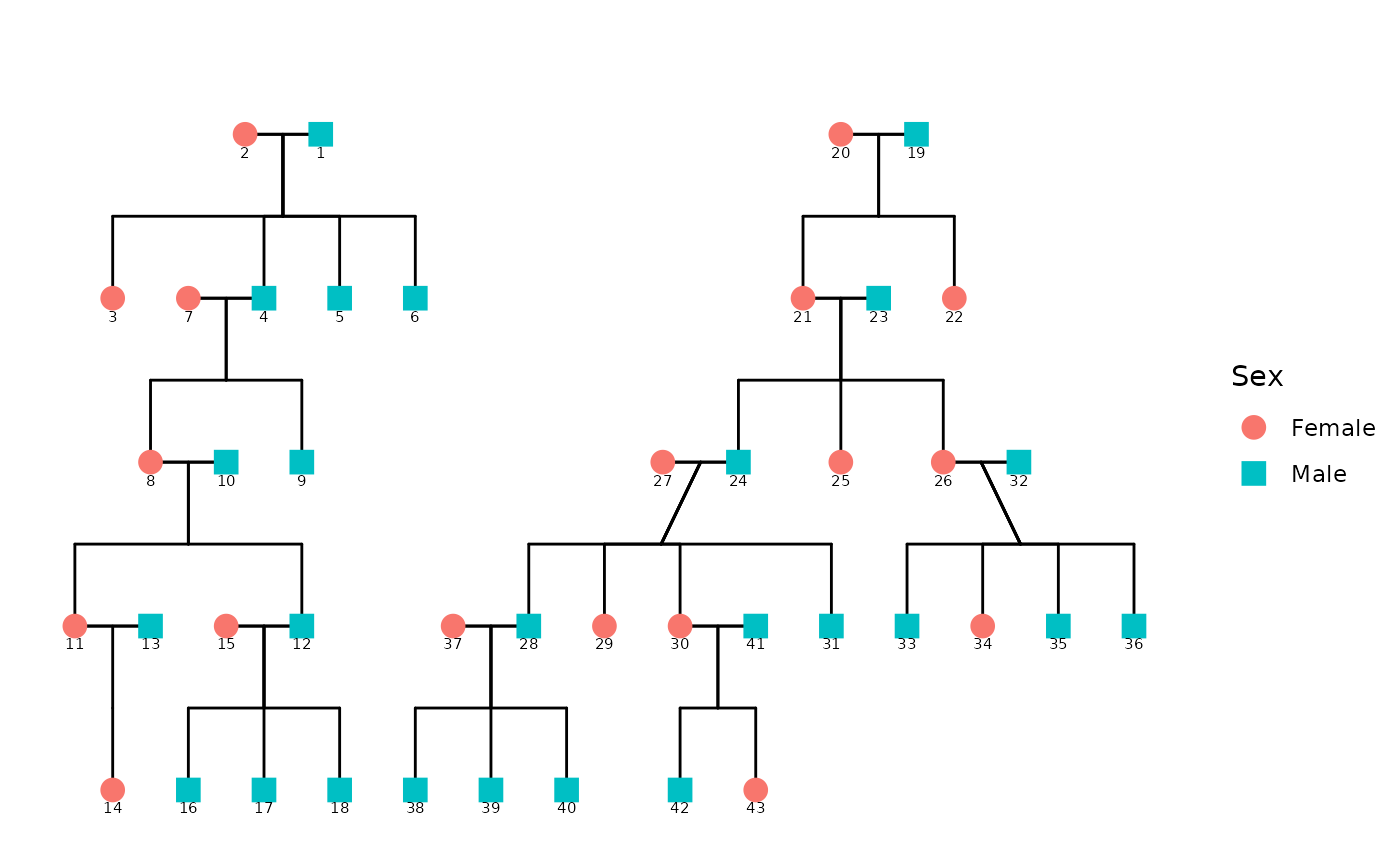
Generates a ggplot2-based diagram of a pedigree using custom coordinate layout, calculated relationship connections, and flexible styling via `config`. It processes the data using `ped2fam()`. This function supports multiple families and optionally displays affected status and sex-based color/shape.
Usage
ggPedigree(
  ped,
  famID = "famID",
  personID = "personID",
  momID = "momID",
  dadID = "dadID",
  spouseID = "spouseID",
  matID = "matID",
  patID = "patID",
  twinID = "twinID",
  status_column = NULL,
  focal_fill_column = NULL,
  tooltip_columns = NULL,
  overlay_column = NULL,
  overlays = NULL,
  return_widget = FALSE,
  config = list(),
  debug = FALSE,
  hints = NULL,
  interactive = FALSE,
  code_male = NULL,
  sexVar = "sex",
  affected_fill_column = NULL,
  outline_color_column = NULL
)

ggpedigree(
  ped,
  famID = "famID",
  personID = "personID",
  momID = "momID",
  dadID = "dadID",
  spouseID = "spouseID",
  matID = "matID",
  patID = "patID",
  twinID = "twinID",
  status_column = NULL,
  focal_fill_column = NULL,
  tooltip_columns = NULL,
  overlay_column = NULL,
  overlays = NULL,
  return_widget = FALSE,
  config = list(),
  debug = FALSE,
  hints = NULL,
  interactive = FALSE,
  code_male = NULL,
  sexVar = "sex",
  affected_fill_column = NULL,
  outline_color_column = NULL
)
Arguments
- ped
A data frame containing the pedigree data. Needs personID, momID, dadID, and sex columns.
- famID
Character string specifying the column name for family IDs. Defaults to "famID".
- personID
Character string specifying the column name for individual IDs. Defaults to "personID".
- momID
Character string specifying the column name for mother IDs. Defaults to "momID".
- dadID
Character string specifying the column name for father IDs. Defaults to "dadID".
- spouseID
Character string specifying the column name for spouse IDs. Defaults to "spouseID".
- matID
Character string specifying the column name for maternal lines Defaults to "matID".
- patID
Character string specifying the column name for paternal lines Defaults to "patID".
- twinID
Character string specifying the column name for twin IDs. Defaults to "twinID".
- status_column
Character string specifying the column name for affected status. Defaults to NULL.
- focal_fill_column
Character string specifying the column name for focal fill color.
- tooltip_columns
Character vector of column names to show when hovering. Defaults to c("personID", "sex"). Additional columns present in `ped` can be supplied – they will be added to the Plotly tooltip text. Defaults to NULL, which uses the default tooltip columns.
- overlay_column
Character string specifying the column name for overlay alpha values. For a single overlay, this is the simplest interface. For multiple overlays, use the
overlaysparameter instead.- overlays
A list of overlay specifications for adding multiple independent overlay layers. Each element should be a list with at minimum a
columnentry, plus optional entries:code_affected,shape,color,size,stroke,mode. Unspecified entries inherit from theoverlay_*config defaults. Whenoverlaysis provided,overlay_columnis ignored. Example:overlays = list(list(column = "DECES", shape = "cross"), list(column = "PROBAND", shape = 8, color = "red"))- return_widget
Logical; if TRUE (default) returns a plotly htmlwidget. If FALSE, returns the underlying plotly object (useful for further customization before printing).
- config
A list of configuration options for customizing the plot. See getDefaultPlotConfig for details of each option. The list can include:
- code_male
Integer or string. Value identifying males in the sex column. (typically 0 or 1) Default: 1
- segment_spouse_color, segment_self_color
Character. Line colors for respective connection types.
- segment_sibling_color, segment_parent_color, segment_offspring_color
Character. Line colors for respective connection types.
- label_text_size, point_size, segment_linewidth
Numeric. Controls text size, point size, and line thickness.
- generation_height
Numeric. Vertical spacing multiplier between generations. Default: 1.
- shape_unknown, shape_female, shape_male, status_shape_affected
Integers. Shape codes for plotting each group.
- sex_shape_labels
Character vector of labels for the sex variable. (default: c("Female", "Male", "Unknown"))
- unaffected, affected
Values indicating unaffected/affected status.
- sex_color_include
Logical. If TRUE, uses color to differentiate sex.
- label_max_overlaps
Maximum number of overlaps allowed in repelled labels.
- label_segment_color
Color used for label connector lines.
- debug
Logical. If TRUE, prints debugging information. Default: FALSE.
- hints
Data frame with hints for layout adjustments. Default: NULL.
- interactive
Logical. If TRUE, generates an interactive plot using `plotly`. Default: FALSE.
- code_male
Integer or string. Value identifying males in the sex column. (typically 0 or 1) Default: 1
- sexVar
Character string specifying the column name for sex. Defaults to "sex".
- affected_fill_column
Character string specifying the column name for conditional affected fill. When provided, individuals matching the `affected_fill_code_affected` config will have their symbols filled. Default is NULL.
- outline_color_column
Character string specifying the column name for outline color control. When provided, individuals matching `outline_color_code_affected` config will have colored outlines (e.g., blue for included). Default is NULL.