Visualizing Relatedness Matrices with ggRelatednessMatrix()
Source:vignettes/v20_matrix.Rmd
v20_matrix.RmdIntroduction
This vignette demonstrates how to calculate and visualize relatedness
matrices for animal pedigrees using functions from the BGmisc and
ggpedigree packages. We focus on Kluane Red Squirrel Project data, but
the workflow generalizes to any pedigree dataset. The
ggRelatednessMatrix function is a new addition to the
ggpedigree package, which provides a flexible and visually appealing way
to explore patterns of genetic and mitochondrial relatedness within
families. This function is designed to work seamlessly with the
ped2add and ped2mit functions from the BGmisc
package, which calculate additive genetic and mitochondrial relatedness
matrices, respectively.
We will use the new ggRelatednessMatrix function to create ggplot2-based heatmaps of relatedness matrices, inspired by the approaches in the original squirrel population analyses.
Data Preparation
First, load pedigree data and required libraries. The example data is the life‐history and reproductive metrics for 7,799 individual red squirrels from the Kluane Red Squirrel Project (1987–present). See the redsquirrels data documentation for more details.
library(ggpedigree)
# Load the example data
data("redsquirrels")
Calculating Relatedness Matrices
Here we show how to compute additive genetic and mitochondrial relatedness matrices for a target family, as in the red squirrel analysis.
# sumped <- summarizePedigrees(redsquirrels,
#  famID = "famID",
#  personID = "personID",
#  nbiggest = 5
# )


# Set target family for visualization
fam_filter <- 160 # sumped$biggest_families$famID[3]

# Filter for the largest family, recode sex if needed
ped_filtered <- redsquirrels %>%
  recodeSex(code_female = "F") %>%
  filter(famID == fam_filter)

# Calculate relatedness matrices
add_mat <- ped2add(ped_filtered, isChild_method = "partialparent", sparse = FALSE)
mit_mat <- ped2mit(ped_filtered, isChild_method = "partialparent", sparse = FALSE)
Visualizing Relatedness Matrices
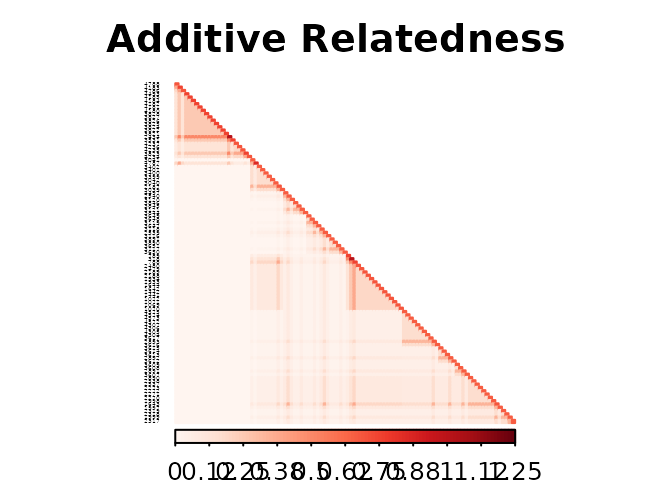
The ggRelatednessMatrix function plots a relatedness matrix as a heatmap, with options for clustering and color customization. Here we show how to create a static plot of the additive genetic relatedness matrix.
p_add <- ggRelatednessMatrix(
  add_mat,
  interactive = FALSE,
  config = list(
    color_palette = c("white", "orange", "red"),
    scale_midpoint = 0.55,
    cluster = TRUE,
    title = "Additive Genetic Relatedness",
    include_upper_triangle = FALSE,
    include_lower_triangle = TRUE
  )
)
#> Warning in buildPlotConfig(default_config = default_config, config = config, :
#> The following config values are not recognized by getDefaultPlotConfig():
#> color_palette, scale_midpoint, cluster, title, include_upper_triangle,
#> include_lower_triangle

p_add
Plot Interactively
Here we plot the mitochondrial relatedness matrix with a custom color palette and interactive features.
p_mit <- ggRelatednessMatrix(
  mit_mat,
  interactive = TRUE,
  config = list(
    color_palette = c("white", "skyblue", "darkblue"),
    scale_midpoint = 0.55,
    cluster = TRUE,
    title = "Mitochondrial Relatedness",
    text_size = 6,
    return_widget = TRUE
  )
)
#> Warning in buildPlotConfig(default_config = default_config, config = config, :
#> The following config values are not recognized by getDefaultPlotConfig():
#> color_palette, scale_midpoint, cluster, title, text_size
Dragging the mouse over the plot will show the relatedness value for each pair of individuals. You can also zoom in and out using the mouse wheel or by clicking and dragging.
p_mitCustomization Options
You can adjust clustering, color scales, labels, and more using the config list. For example, to turn off clustering:
p_add_noclust <- ggRelatednessMatrix(
  add_mat,
  config = list(
    cluster = FALSE, title = "Additive Relatedness (No Clustering)" # ,
    #  geom = "geom_raster"
  )
)
#> Warning in buildPlotConfig(default_config = default_config, config = config, :
#> The following config values are not recognized by getDefaultPlotConfig():
#> cluster, title
p_add_noclust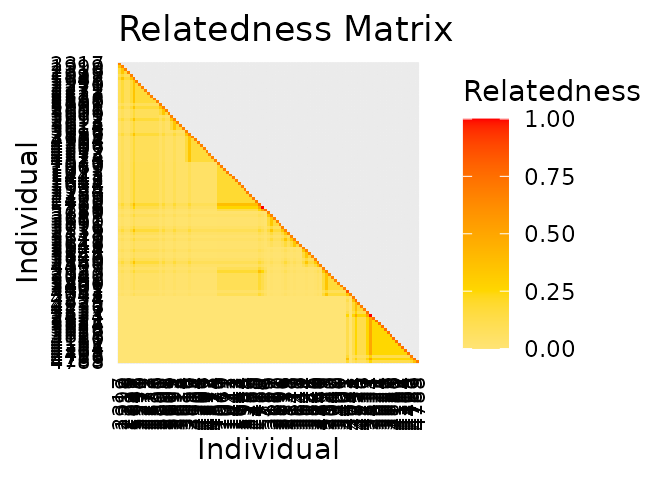
Comparison to Base R and Other Approaches
For comparison, here is how the same matrix would be plotted in corrplot, as in earlier squirrel analyses:
if (requireNamespace("corrplot", quietly = TRUE)) {
  corrplot::corrplot(
    as.matrix(add_mat),
    method = "color",
    type = "lower",
    col.lim = c(0, 1.25),
    is.corr = FALSE,
    title = "Additive Relatedness",
    order = "hclust",
    col = corrplot::COL1("Reds", 100),
    tl.pos = "l", tl.col = "black", tl.srt = 5, tl.cex = 0.2,
    mar = c(0, 0, 2, 0)
  )
}
Conclusions
The ggRelatednessMatrix function provides a flexible and visually appealing way to explore patterns of genetic and mitochondrial relatedness within families. This workflow integrates seamlessly with tools from BGmisc and ggpedigree, supporting reproducible, publication-quality visualization for quantitative genetic analysis.